

How do you set future breakpoints in Debugger?
I'm using the JavaScript Debugger in Firefox v. 28.0 and following a textbook lesson that requires setting a future breakpoint in an HTML file. However, in the shortcut menu that appears, I see options for regular and conditional breakpoints, but not a future type. I know that you could apply future breakpoints in earlier versions, but is that no longer possible?
Zgjidhje e zgjedhur
Thanks so much for those screenshots! That helped a lot!
I showed them to the developers of the Firefox devtools and they agreed the term "future breakpoints" must have come from the Venkman debugger. And that the author mistakenly said Firefox had them.
One of the developer's reply: I think that future breakpoints term comes originally from Venkman, where it represents a promise that real breakpoint will be set as soon as possible e.g. as soon as the script exists again or is compiled.
Another developer comment: Unfortunately devtools' debugger doesn't have them. That is, it would be useful to be able to set a breakpoint in arbitrary JS that you knew would be loaded in the future but that isn't possible right now.
But another developer seems to think the feature already exists: Dev #1: Btw. I think that future breakpoints actually already work. You can set a breakpoint any time and it's applied on the right script when it's created. No additional UI needed.
Dev #2: you mean they work under the hood - but there's no UI for it? :) Dev #2: if the script isn't created, it doesn't show up in the debugger UI...
Dev #1: and yes, if the script doesn't exist it isn't displayed in the UI, so you need to operate the (debuggee) page to create it at least once, have it in the UI and set the breakpoint associated with the url/line/column. If the breakpoint is persistent across page-reloads and even firefox-restarts (like in Firebug) it's there all the time till the user explicitly delete it and till the URL of the script exists. It's created automatically for the script even if the script isn't in the UI at the beginning.
How to continue after a breakpoint is reached: There should be a blue triangle (looks like a play button) in the top left corner of the Debugger UI, once you click that it should resume execution. You can also press the F8 key to resume.
See: https://developer.mozilla.org/en-US/docs/Tools/Debugger#toolbar "Pause/Resume (F8): pauses or resumes execution of the script you're debugging. When it's blue and "pressed", as above, that means the script is paused, either because you've paused it with this button or because you've hit a breakpoint."
Also see this page for many good tips and screenshots: https://developer.mozilla.org/en-US/docs/Tools/Debugger
Lexojeni këtë përgjigje brenda kontekstit 👍 1Krejt Përgjigjet (3)
Hi, I asked a Firefox developer about your question but he said it was never possible to set a future breakpoint from the UI. How were you setting the future breakpoints in previous versions? Do you remember the last Firefox version that had this feature?
If you can take a screenshot of that, that'd help too. If you need a link to a older Firefox version, let me know.
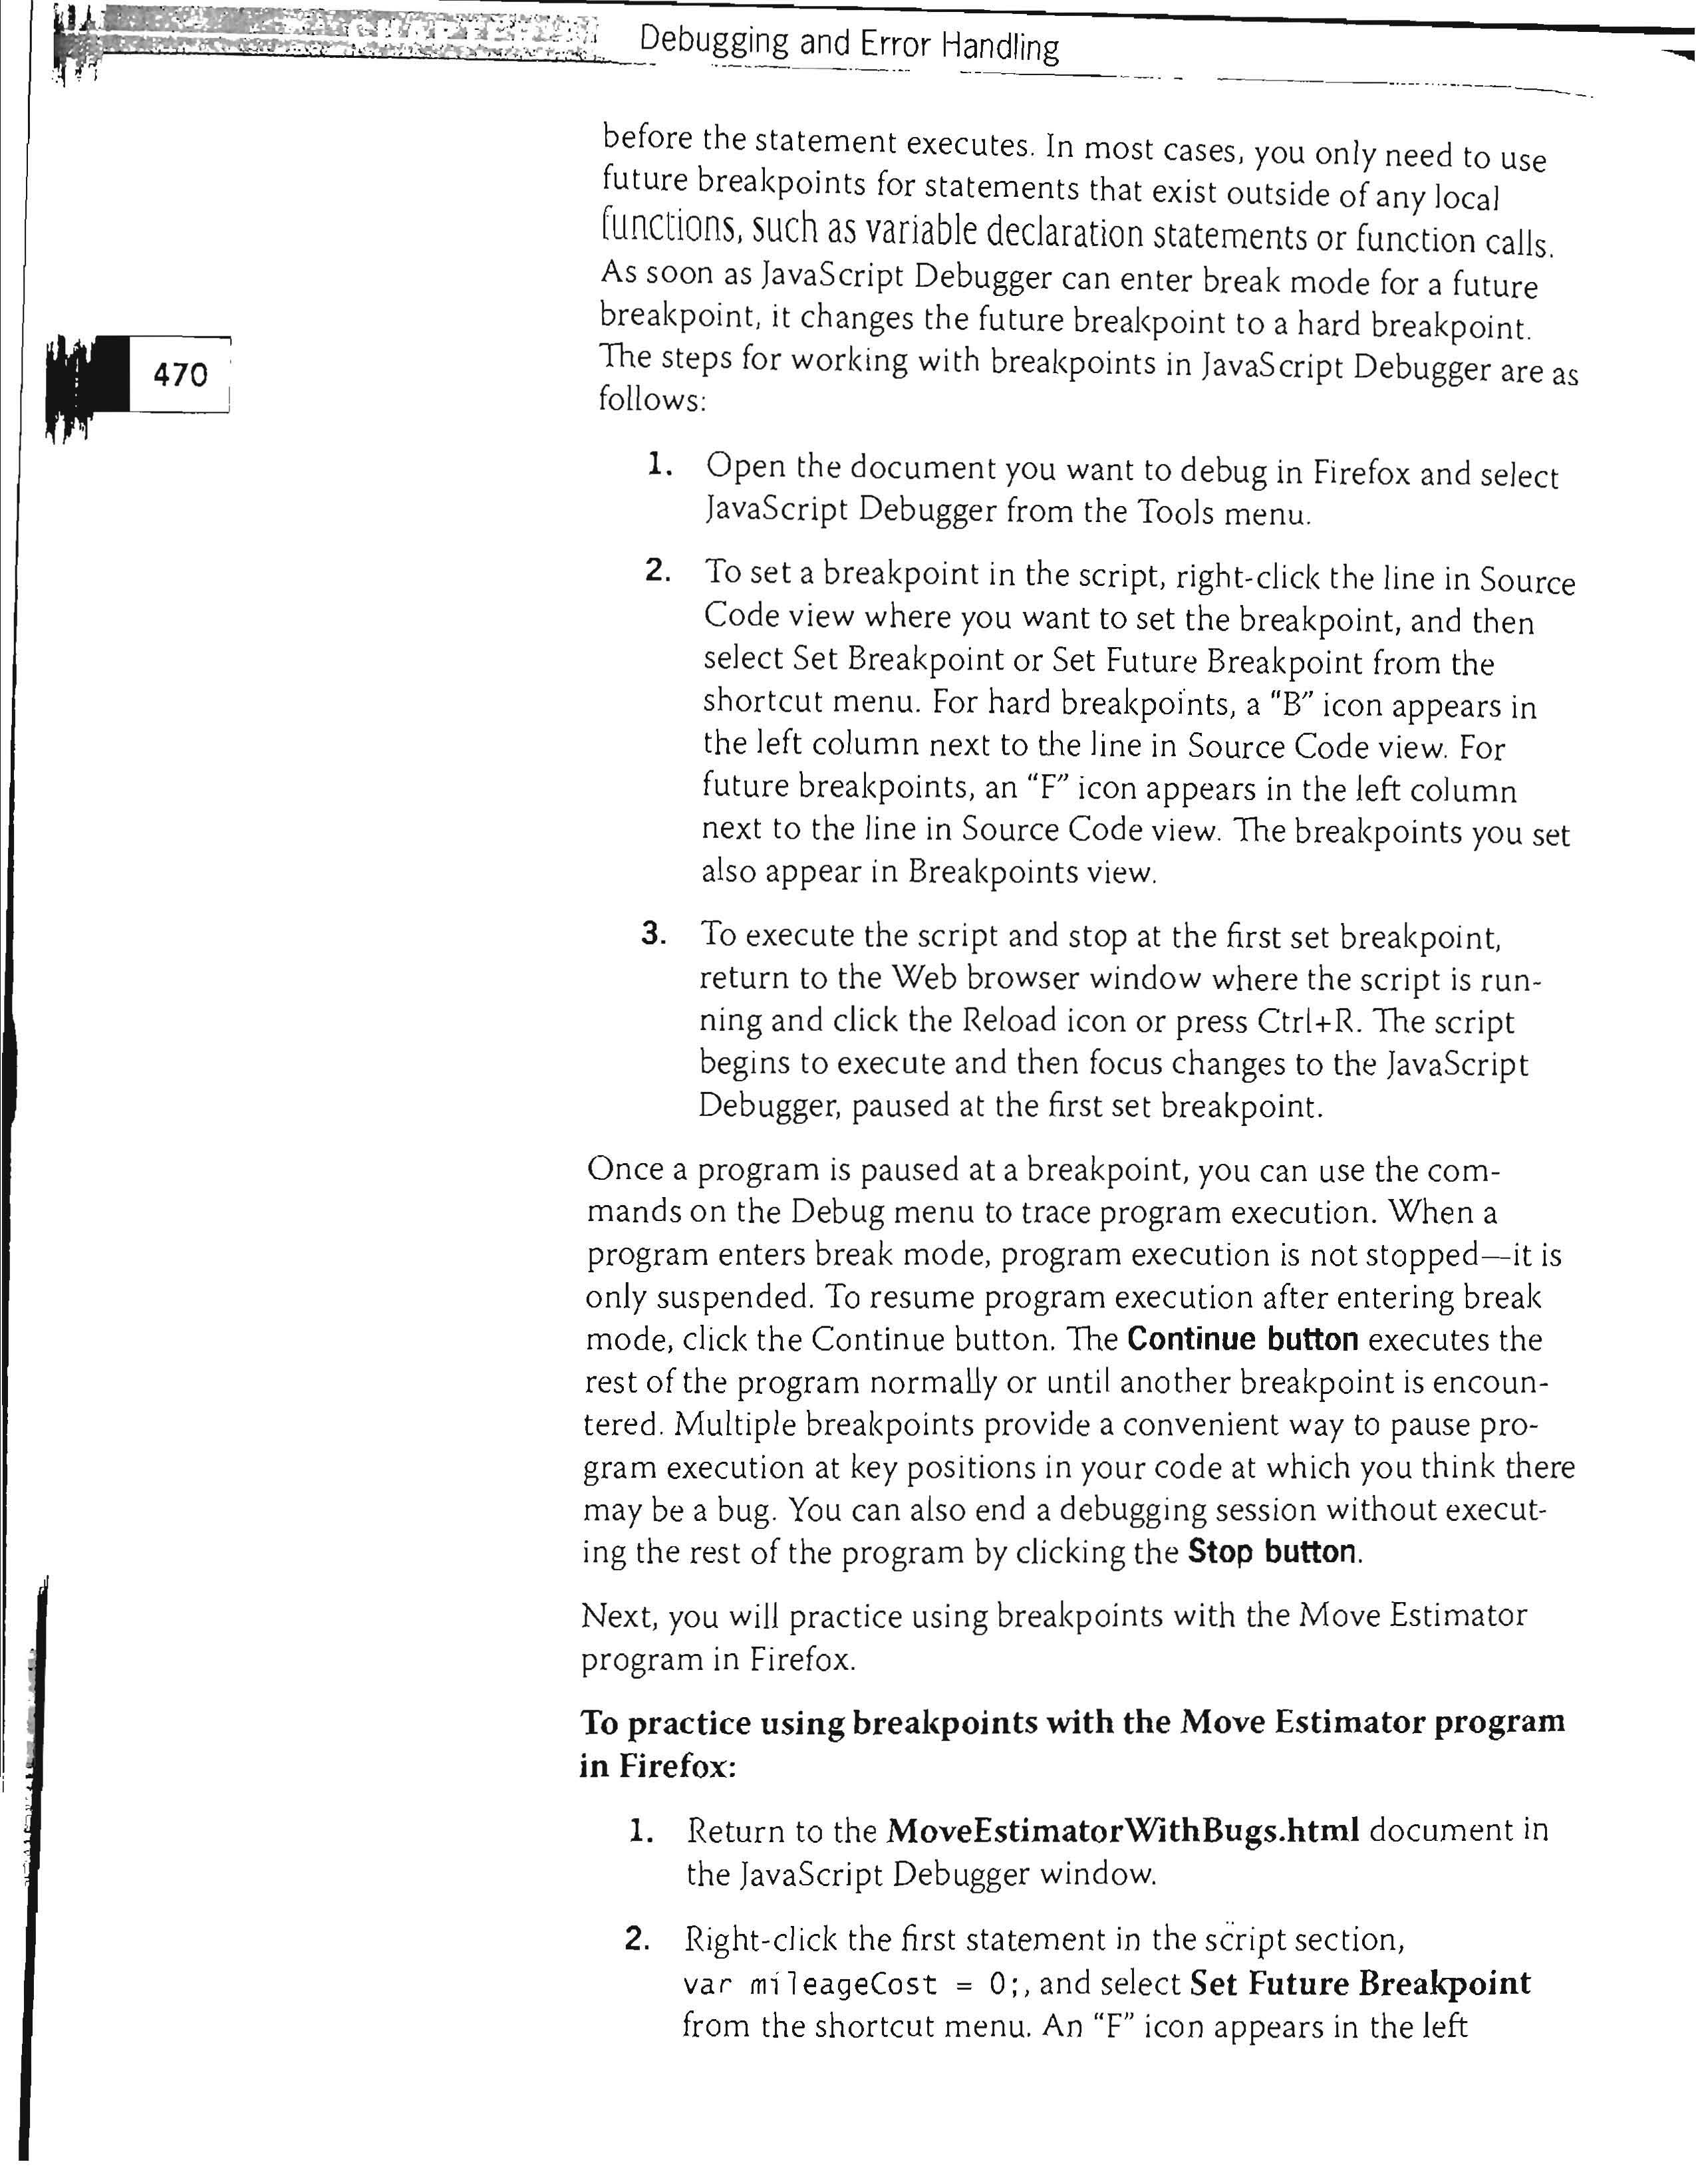
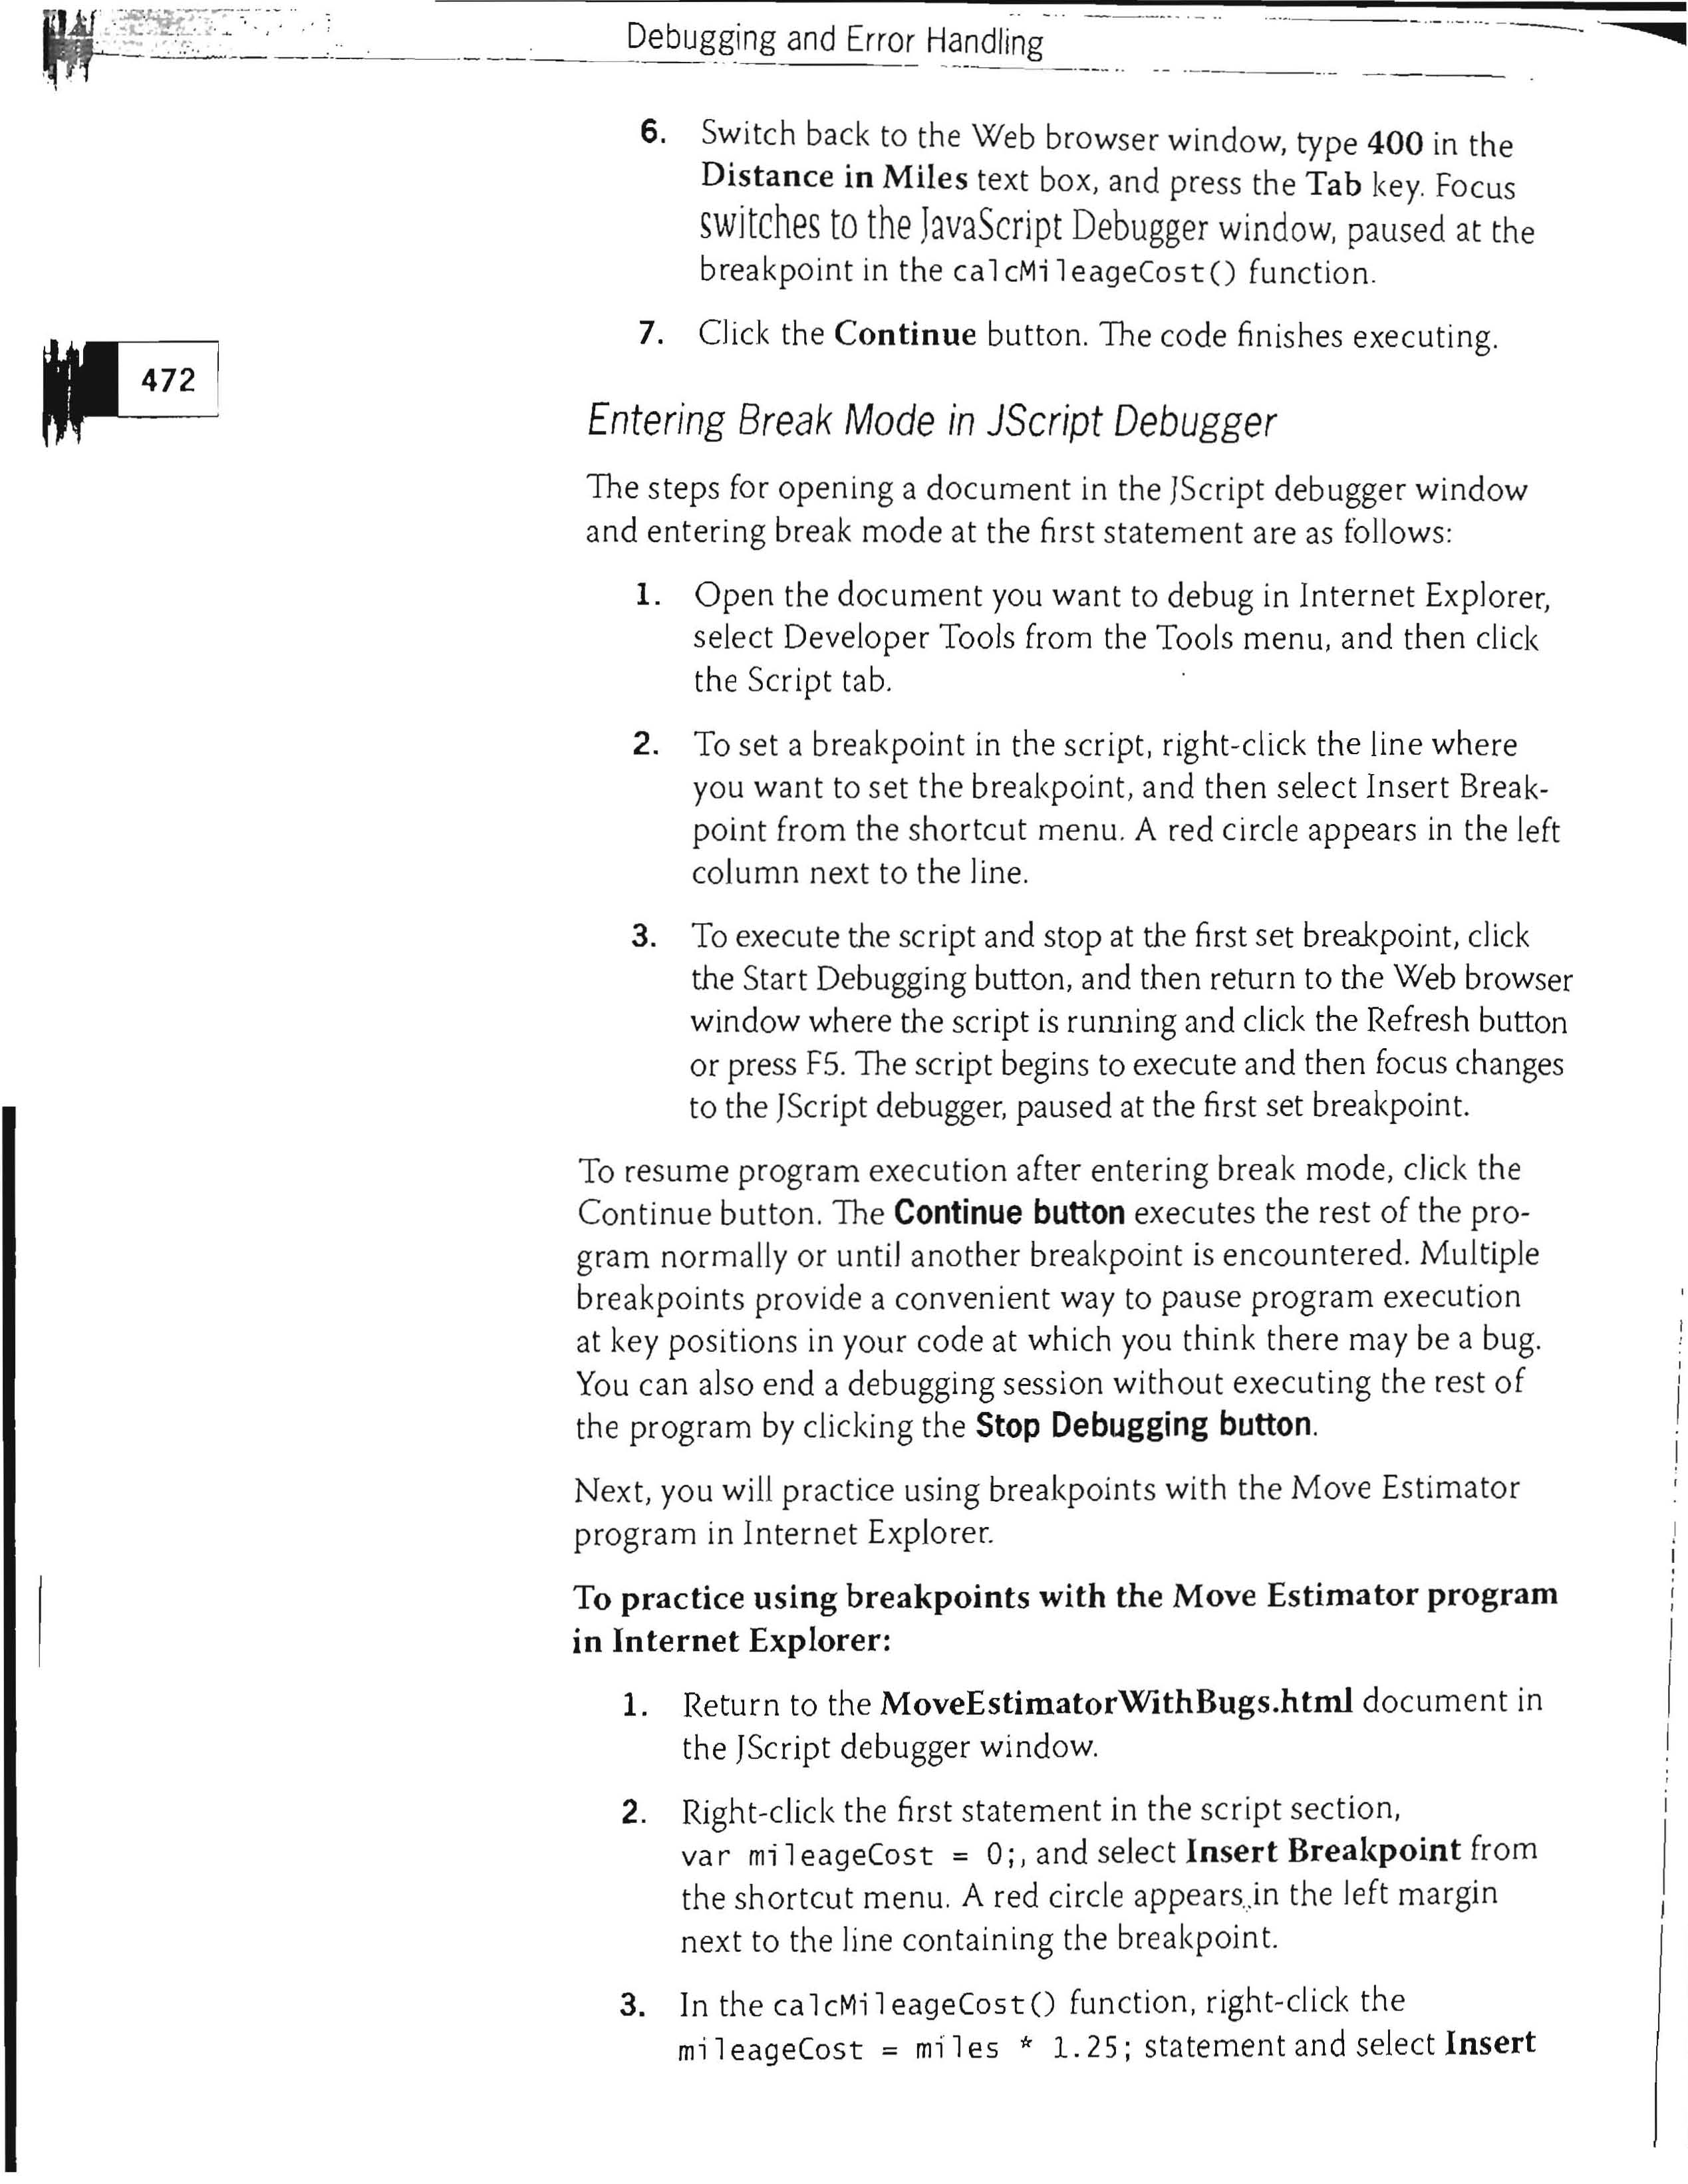
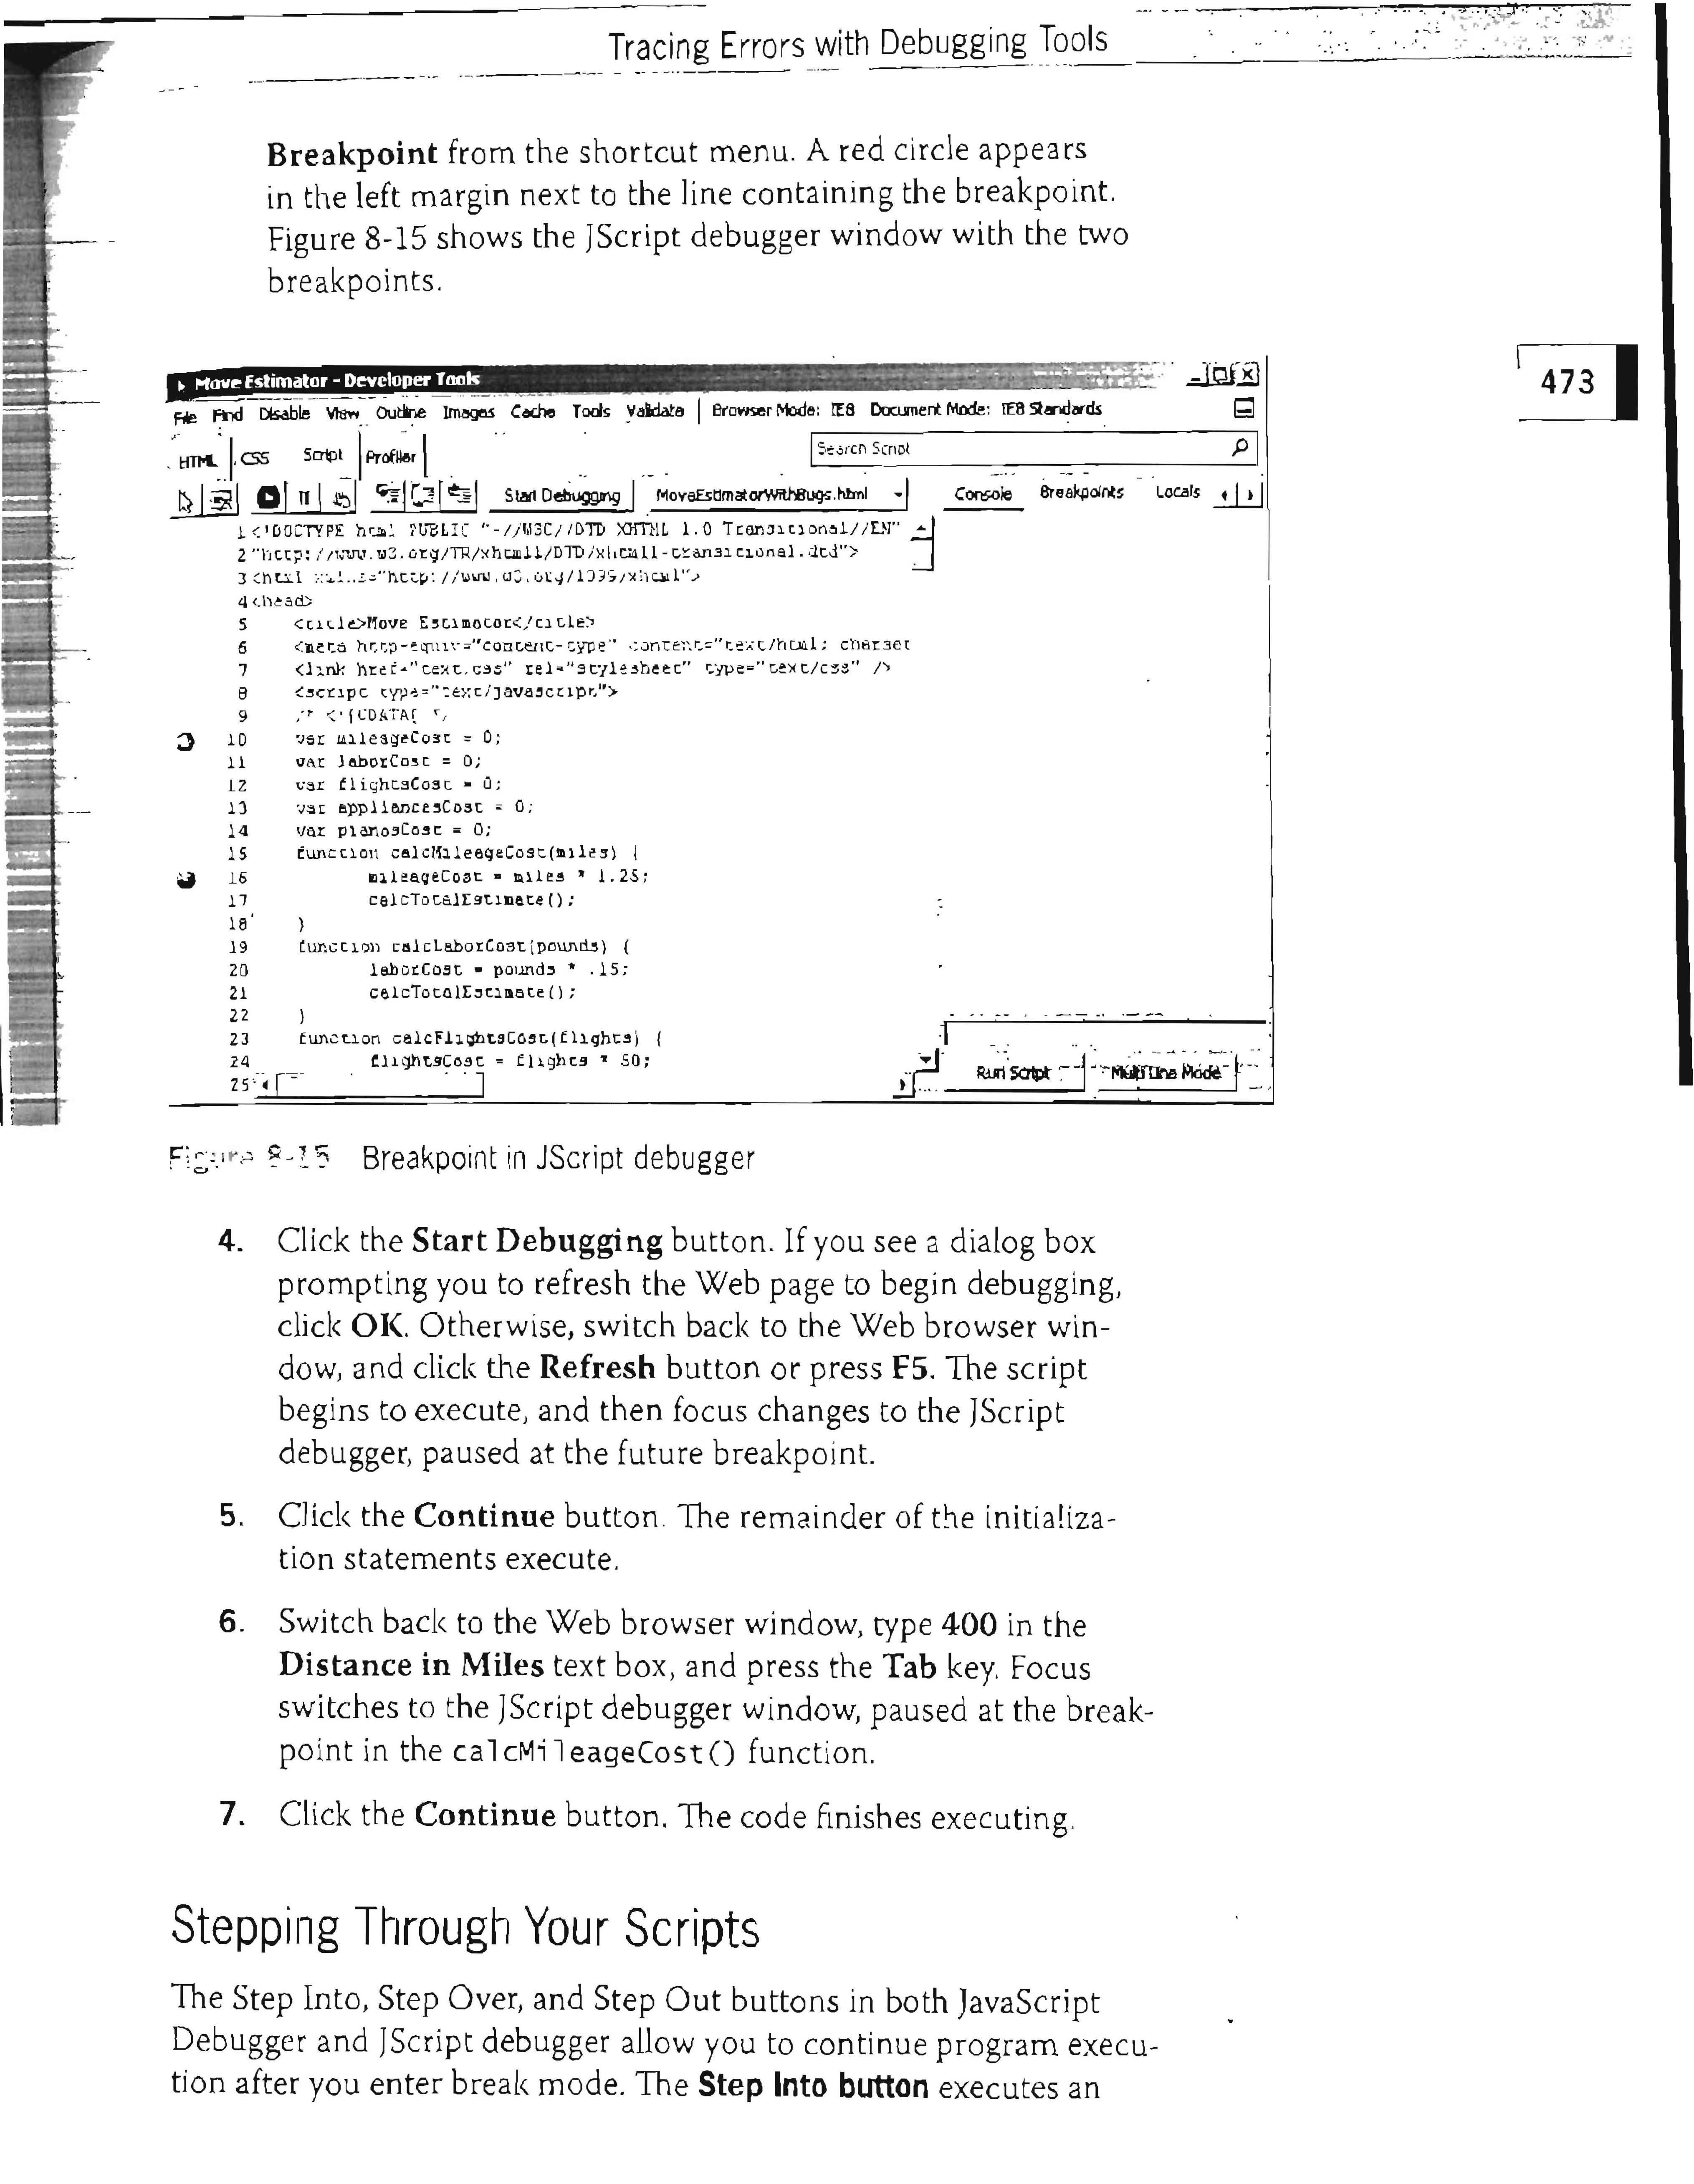
The setting of future breakpoints was covered by the author of a textbook I'm using to study JavaScript. I don't know what version of Firefox is being described. I will try to attach an image of those chapter pages for your review. Another concern is that the author mentioned a Continue button to resume execution after the program encounters a breakpoint. I don't see that button on the Debugger and can't figure out how to restart execution.
Zgjidhja e Zgjedhur
Thanks so much for those screenshots! That helped a lot!
I showed them to the developers of the Firefox devtools and they agreed the term "future breakpoints" must have come from the Venkman debugger. And that the author mistakenly said Firefox had them.
One of the developer's reply: I think that future breakpoints term comes originally from Venkman, where it represents a promise that real breakpoint will be set as soon as possible e.g. as soon as the script exists again or is compiled.
Another developer comment: Unfortunately devtools' debugger doesn't have them. That is, it would be useful to be able to set a breakpoint in arbitrary JS that you knew would be loaded in the future but that isn't possible right now.
But another developer seems to think the feature already exists: Dev #1: Btw. I think that future breakpoints actually already work. You can set a breakpoint any time and it's applied on the right script when it's created. No additional UI needed.
Dev #2: you mean they work under the hood - but there's no UI for it? :) Dev #2: if the script isn't created, it doesn't show up in the debugger UI...
Dev #1: and yes, if the script doesn't exist it isn't displayed in the UI, so you need to operate the (debuggee) page to create it at least once, have it in the UI and set the breakpoint associated with the url/line/column. If the breakpoint is persistent across page-reloads and even firefox-restarts (like in Firebug) it's there all the time till the user explicitly delete it and till the URL of the script exists. It's created automatically for the script even if the script isn't in the UI at the beginning.
How to continue after a breakpoint is reached: There should be a blue triangle (looks like a play button) in the top left corner of the Debugger UI, once you click that it should resume execution. You can also press the F8 key to resume.
See: https://developer.mozilla.org/en-US/docs/Tools/Debugger#toolbar "Pause/Resume (F8): pauses or resumes execution of the script you're debugging. When it's blue and "pressed", as above, that means the script is paused, either because you've paused it with this button or because you've hit a breakpoint."
Also see this page for many good tips and screenshots: https://developer.mozilla.org/en-US/docs/Tools/Debugger
Ndryshuar nga NoahSUMO