

cannot debug addon
Hi,
Thanks to Mozilla for continuing to develop such a clean browser, with movies made of GIF instead of much larger files.
So we have developed an extension or add-on for many years using the same method. But recently ( maybe I forgot ), with a new developer profile, I am unable to edit any files because the .xpi extension in the extensions folder, is compressed and cannot be navigated in a file Explorer.
In the past, I just install the extension and change the file extension from .xpi to .zip, and then extract into a folder with the same name. Then delete the .xpi/.zip folder, and the new folder acts as a pointer for the same instance of installation. And I can just modify the files in that folder usually and I don't need to restart the browser to see the changes. But lately I cannot do this.
What is the best way to debug the add-on with the least number of steps?
Thanks,
Josh
Seçilen çözüm
admin101 said
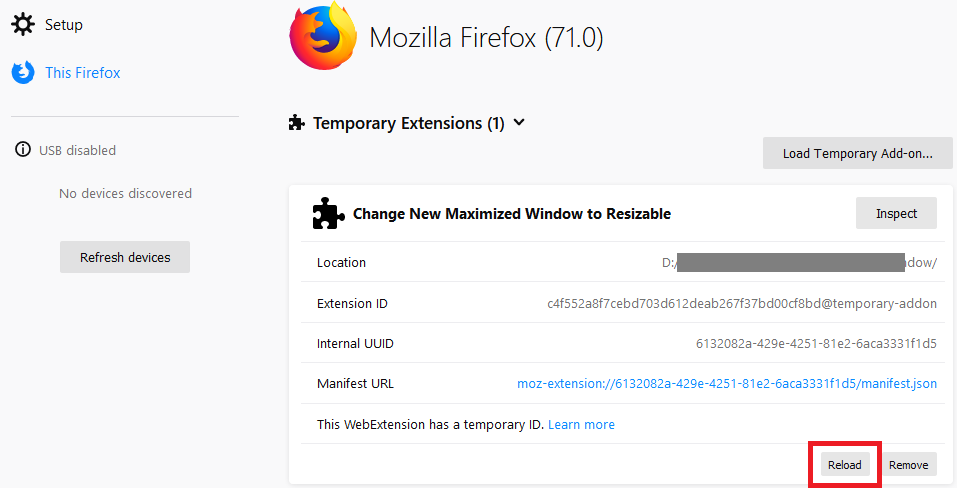
For example, these days I have to edit the JavaScript file, CTR+S, then open new Mozilla developer edition, open the debugging tab, then click the open temporary add-on, then select the file, check the operation of the add-on.
Once you temporarily load the extension via about:debugging, after modifying any of its source files, you just have to click the Reload button to reload the extension. (See attached screenshot.)
Bu yanıtı konu içinde okuyun 👍 0Tüm Yanıtlar (5)
You should be able to point to a given file inside a folder (unzipped/compressed) with the appropriate contents (manifest.json, js, icon/48.png) to load an addon temporarily, then you can just reload it each time you make changes to those files? per https://developer.mozilla.org/en-US/docs/Mozilla/Add-ons/WebExtensions/Your_first_WebExtension (obviously this isn't your first but details this method)
In about:debugging#/runtime/this-firefox
I think that'd be simplest, but someone might have a better method.
Hi evhenry,
Thanks for the support.
Yes I know about loading the add-on from there, but it just seems quite cumbersome to keep reloading.
Josh
admin101 tarafından tarihinde düzenlendi
For example, these days I have to edit the JavaScript file, CTR+S, then open new Mozilla developer edition, open the debugging tab, then click the open temporary add-on, then select the file, check the operation of the add-on.
Previously, after editing the JavaScript file, CTR+S, ALT+TAB to Mozilla developer edition, then check the operation of the add-on.
Seçilen çözüm
admin101 said
For example, these days I have to edit the JavaScript file, CTR+S, then open new Mozilla developer edition, open the debugging tab, then click the open temporary add-on, then select the file, check the operation of the add-on.
Once you temporarily load the extension via about:debugging, after modifying any of its source files, you just have to click the Reload button to reload the extension. (See attached screenshot.)
admin101 said
For example, these days I have to edit the JavaScript file, CTR+S, then open new Mozilla developer edition, open the debugging tab, then click the open temporary add-on, then select the file, check the operation of the add-on. Previously, after editing the JavaScript file, CTR+S, ALT+TAB to Mozilla developer edition, then check the operation of the add-on.
Thanks! That's very helpful.