

Network Response not formated on devtools
I want to see a response in a formated/pretty way to check for errors on my work. According to this link https://firefox-source-docs.mozilla.org/devtools-user/network_monitor/request_details/index.html#network-monitor-request-details-response-tab it should be possible to do so, clicking a button which formats the response in the network part of the devtools, however this button does not exist on my devtools. In chrome there is the preview tab that shows the response in the way I need, and also as the button to format the response in the response tab. Is it a bug on my end? If not, why is it that way?
所有回覆 (5)
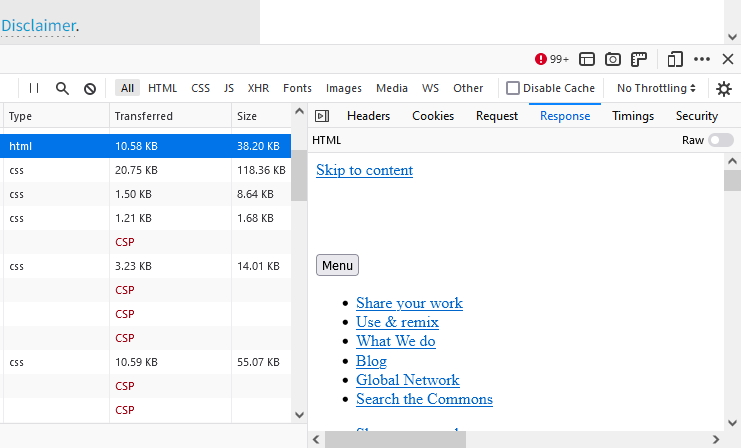
I think it depends on the file type. For example, Firefox defaults to the JSON view for JSON, or rendered HTML for HTML. I'm attaching an example screenshot (as you can see, Raw is turned off). Not on yours?

jscher2000 - Support Volunteer said
I think it depends on the file type. For example, Firefox defaults to the JSON view for JSON, or rendered HTML for HTML. I'm attaching an example screenshot (as you can see, Raw is turned off). Not on yours?
I am having this issue on this page: https://www.theretailcorrection.com/collections/26-3-22-weekly-retail-release
If you filter the responses with the word "filter" one of them returns a JS file starting with:
/**/ typeof BoostPFSFilterCallback ===
And I want it to be formatted, could you test it?
For JavaScript code, if you want to "pretty print" it, you need to view the file in the Debugger panel.
jscher2000 - Support Volunteer said
For JavaScript code, if you want to "pretty print" it, you need to view the file in the Debugger panel.
Is there a way to see it like Chrome shows it in the preview tab? In Chrome if there is a JSON(or a object, I am not sure now) inside a JS file it "colappses" the vector of objects and you can open one by one by its index. If you the store I sent for example you can see in the response a vector of products of the collection page.
I'm not the best person to compare because I don't use Chrome.
The DevTools team has its own forum, by the way: